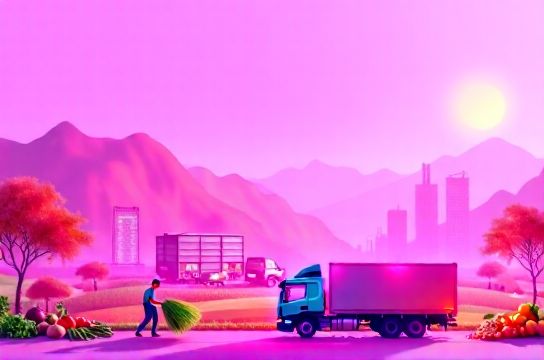
How Fresh Produce Moves in Chinese Markets
- Date:
- Views:187
- Source:The Silk Road Echo
If you've ever wandered through a bustling morning market in Beijing or scanned QR codes on veggies in a Shanghai smart supermarket, you've touched the beating heart of China's fresh produce supply chain. It’s fast, fragmented, and fascinating — a blend of ancient haggling and cutting-edge tech.
Every day, over 700 million tons of fruits and vegetables are consumed across China, making it the world’s largest producer and consumer of fresh produce (FAO, 2023). But how does that kale get from a Yunnan farm to a Guangzhou kitchen in under 48 hours? Let’s peel back the layers.
The Farm-to-Fork Journey: Not as Simple as It Sounds
China’s produce logistics rely on a hybrid model: traditional wholesale markets still dominate, but digital platforms like Pinduoduo and Alibaba’s Cainiao are rewriting the rules. Over 80% of fresh produce passes through tiered wholesale hubs — first regional, then city-level, and finally local wet markets.
But here’s the twist: spoilage rates hover around 15–20%, far above the 5% seen in developed countries. Why? Fragmented cold chains and middlemen markups.
Digital Disruption: The Rise of Community Group Buys
In 2020, community group buying exploded. Platforms like Meituan Youxuan and JD Daojia now connect farmers directly with neighborhood leaders, slashing delivery time and waste. By 2023, this model accounted for 12% of all fresh produce sales — up from just 2% in 2019 (iiMedia Research).
These networks use hyper-local warehouses (distributor hubs within 10 km of consumers) and same-day delivery, keeping produce fresher longer.
Key Logistics Hubs & Flow Patterns
Major distribution centers include:
- Beijing's Xinfadi Market – Supplies 70% of the capital’s produce
- Guangzhou's Jiangnan Market – Handles over 6 million tons annually
- Shanghai's Jing’an Market – Leader in traceability tech adoption
Seasonal shifts also shape flows. For example, during winter, 60% of leafy greens in northern cities come from Hainan Island’s tropical farms.
Data Snapshot: Fresh Produce Distribution Efficiency
| Metric | China | USA/EU Avg |
|---|---|---|
| Avg. Transport Time (Farm to Retail) | 2–3 days | 1–2 days |
| Cold Chain Penetration | ~35% | ~90% |
| Post-Harvest Loss Rate | 15–20% | 5–8% |
| e-Commerce Share of Fresh Sales | 18% | 12% |
This table shows both challenges and opportunities. While China lags in cold chain coverage, its e-commerce integration is ahead of Western peers — thanks to mobile payment ubiquity and dense urban populations.
The Future? Smart Farms and Blockchain Tracking
Forward-thinking provinces like Zhejiang are piloting blockchain-based traceability. Shoppers scan a code and see not just the farm origin, but harvest date, pesticide use, and transport history.
Meanwhile, AI-powered demand forecasting helps reduce overstocking. In pilot programs, waste dropped by 30%.
As China pushes for ‘dual circulation’ — boosting domestic consumption while maintaining export strength — expect tighter, smarter produce networks. The future of freshness isn’t just fast; it’s intelligent.
So next time you bite into a crisp apple from Xinjiang, remember: it didn’t just grow there. It traveled through one of the world’s most complex, evolving food ecosystems.